
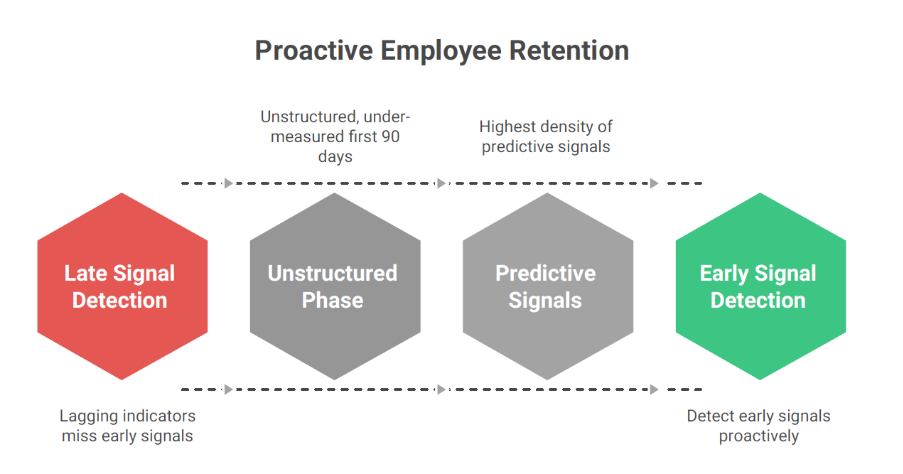
1. The Problem: Organizations React Too Late
Most organizations measure employee success through lagging indicators:
- Attrition
- Performance ratings
- Engagement scores
By the time these metrics appear, the underlying issues have already materialized.
The real failure is not attrition — it is the inability to detect early signals.
The first 90 days of an employee lifecycle contain the highest density of predictive signals, yet this phase remains largely unstructured and under-measured.
2. The Shift: From Onboarding Process to Predictive System
Onboarding is traditionally treated as:
- A checklist
- A compliance process
- A time-bound activity
This approach fails to answer a critical question:
👉 “Is this employee likely to succeed, disengage, or exit?”
Lets introduces a different paradigm:
Onboarding as a measurable, predictive system of stakeholder intelligence
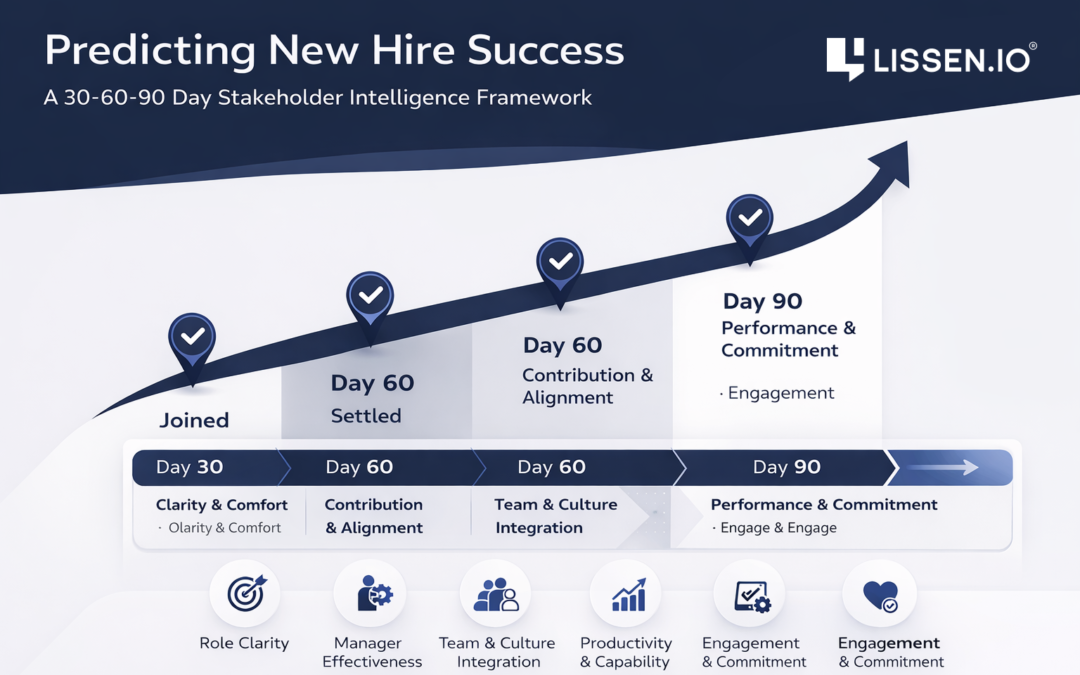
3. The New Hire Success Predictor Model
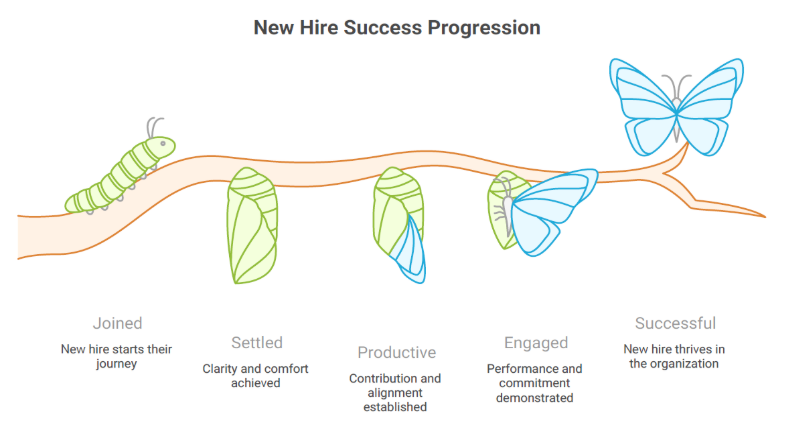
The model follows a natural progression:
Joined → Settled → Productive → Engaged
This progression is not linear—it is measurable across defined checkpoints:
- Day 30 → Clarity & Comfort
- Day 60 → Contribution & Alignment
- Day 90 → Performance & Commitment
Each stage provides structured signals across five core dimensions.
4. The 5-Dimensional Measurement Framework
Across all stages, employee experience is measured through:
- Role Clarity
Clarity of expectations, priorities, and success metrics
- Manager Effectiveness
Quality of guidance, feedback, and support
- Team & Cultural Integration
Sense of belonging, collaboration, and alignment
- Productivity & Capability
Readiness to perform and deliver outcomes
- Engagement & Commitment
Motivation, emotional connection, and intent to stay
5. The 30-60-90 Day Intelligence Layer
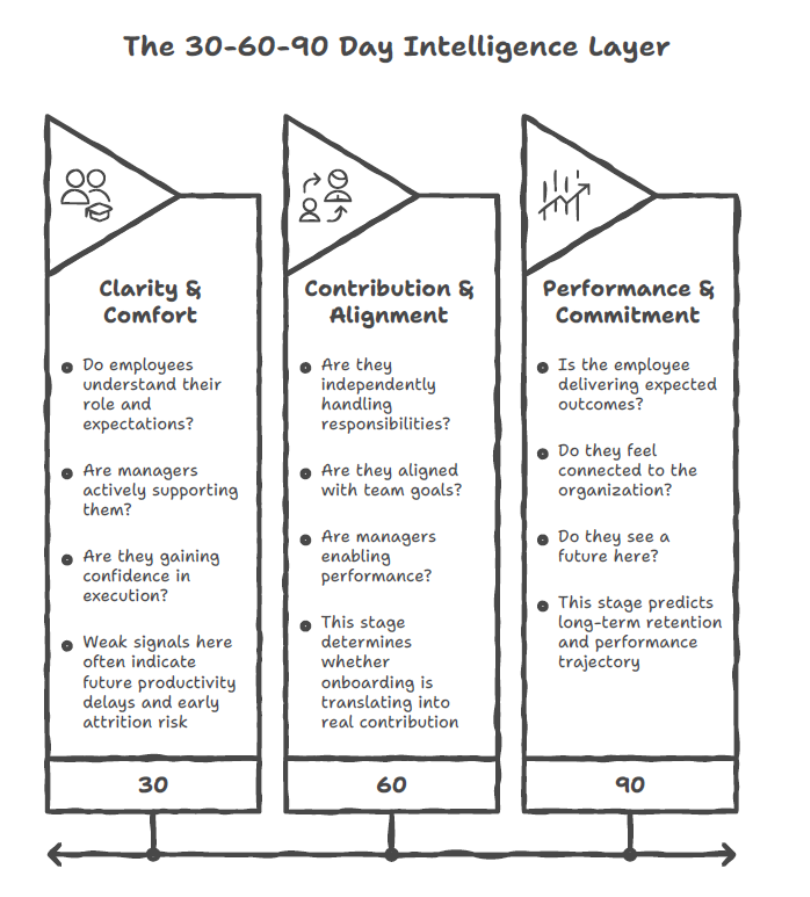
Day 30: Clarity & Comfort
At this stage, the focus is on orientation and early confidence:
- Do employees understand their role and expectations?
- Are managers actively supporting them?
- Are they gaining confidence in execution?
👉 Weak signals here often indicate future productivity delays and early attrition risk
Day 60: Contribution & Alignment
The employee transitions from learning to contributing:
- Are they independently handling responsibilities?
- Are they aligned with team goals?
- Are managers enabling performance?
👉 This stage determines whether onboarding is translating into real contribution
Day 90: Performance & Commitment
This is the most critical checkpoint:
- Is the employee delivering expected outcomes?
- Do they feel connected to the organization?
- Do they see a future here?
👉 This stage predicts long-term retention and performance trajectory
6. From Signals to Intelligence: The 90-Day Health Index
Instead of isolated feedback, the model aggregates signals into a 90-Day Health Index.
Example:
- Day 30 → 72 (Amber)
- Day 60 → 76 (Green)
- Day 90 → 82 (Green)
👉 This progression reflects stabilization and growth
This index provides leadership with a single, interpretable view of onboarding effectiveness.
7. Dimension-Level Insights: What Actually Drives Success
Beyond aggregate scores, the model identifies which dimensions are improving or failing:
- Productivity typically lags early but improves sharply
- Manager effectiveness often remains a constraint
- Role clarity shows strong correlation with early success
👉 This enables targeted interventions, not generic improvements
8. Manager Assimilation: The Hidden Variable
One of the most critical insights:
Onboarding success is disproportionately influenced by managers
The model evaluates managers through a Manager Assimilation Score (MAS):
- Combines multiple dimensions with weighted importance
- Identifies strong vs weak onboarding managers
- Maps directly to employee risk levels
Example:
- High MAS → Low risk (0–5%)
- Low MAS → High risk (10–30%+)
👉 This shifts accountability from HR process to manager effectiveness
9. Predicting Risk: The New Hire Risk Index
The system translates experience into predictive risk scores.
Inputs include:
- 30-60-90 day scores
- Engagement signals (eNPS converted to normalized scale)
Example outcome:
👉 Final Score: 65.5 → Medium Risk
This enables organizations to:
- Identify at-risk employees early
- Intervene proactively
- Prevent avoidable attrition
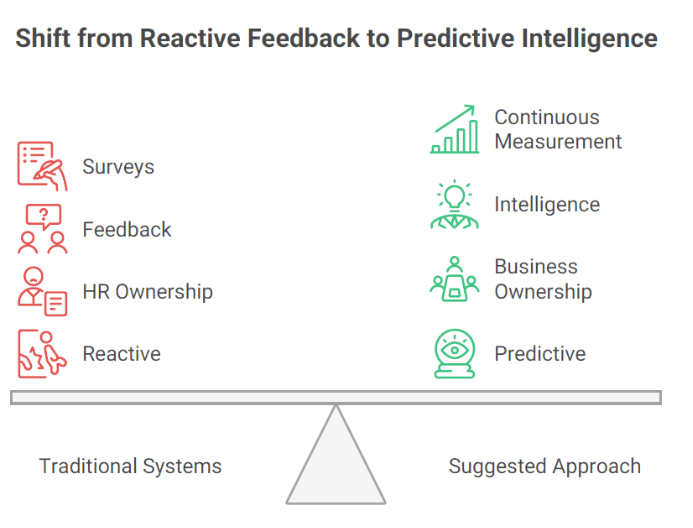
10. From Feedback to Business Intelligence
Traditional systems collect feedback.
This model creates:
👉 Structured intelligence → Predictive insights → Actionable decisions
Key shifts:
| Traditional | Suggested Approach |
| Surveys | Continuous measurement |
| Feedback | Intelligence |
| HR ownership | Business ownership |
| Reactive | Predictive |
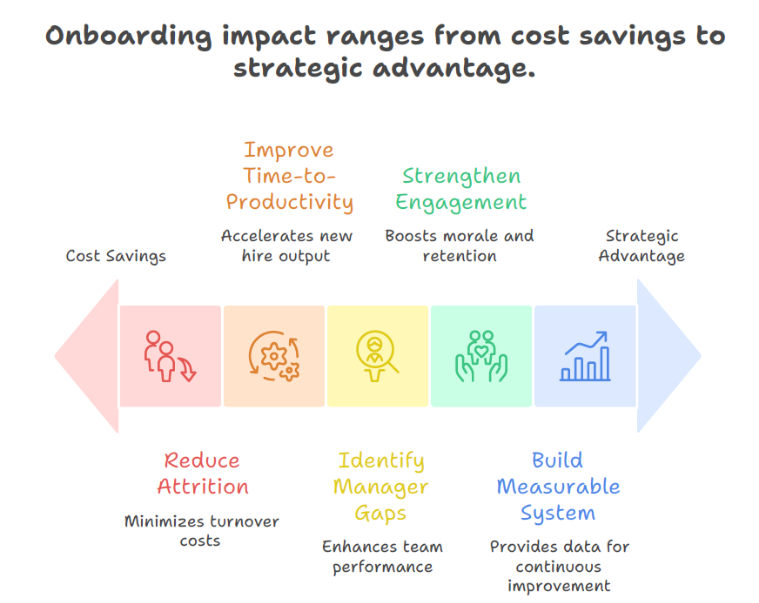
11. Business Impact
Organizations implementing this approach can:
- Reduce early attrition
- Improve time-to-productivity
- Identify manager effectiveness gaps
- Strengthen employee engagement early
- Build a measurable onboarding system
12. Conclusion: The Future of Onboarding
The future is not about improving onboarding programs.
It is about measuring onboarding as a system that predicts business outcomes.
Financial metrics tell you what happened.
Stakeholder intelligence tells you why — and what will happen next.